IQ Tails of Race & Gender

ouroboros042Fear not, I am not going to perform any analysis proving the intellectual superiority of any race or gender. Also, as a 100% Spaniard (I need to check on that though) I do not belong to the “elite” of ethnics groups disputing supremacy, namely: Northern Europeans, Jews and Far-East Asians and, quite frankly, I feel kinda good about it since I’d rather stick to the Latin Lover stereotype which, by all means, it is true.

Recently I came across a video titled Steven Pinker – Jews, Genes and Intelligence. Typically I would have disregarded this video as your standard white supremacy internet rhetoric however, I know Steven Pinker from his published works and achievements, and he is no small fish in the Psychology and Cognitive Science world. That is why I decided to give a shot to his video to see what’s what until he began talking about statistics. These are his words:

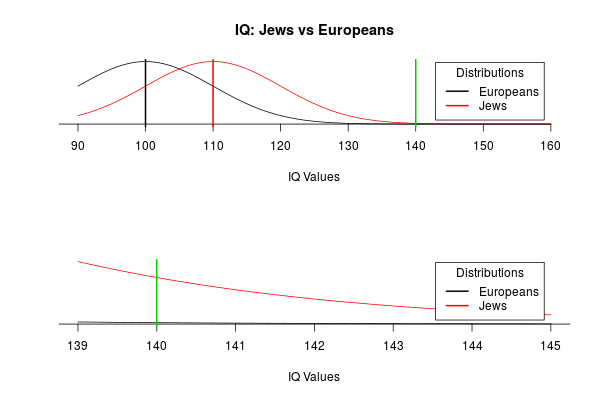
“…Jewish achievements might have an explanation on another fact that has long been known; that Jewish score on average higher on IQ tests than any ethnic group for what there’s comparable data. Their mean IQ is between 108 and 115, the mean of the European population is by definition a hundred which means that the Jewish average is a whole standard deviation higher than the [European] average… Importantly, even if the effect is moderate on average it’s a mathematical fact in Normal Distributions, that is Bell’s Curves, that small effects in the average can translate into huge effects at the extreme… So with one standard deviation difference between groups a score that is three standard deviation above the mean in the higher distribution is four standard deviations in the lower distribution which means there are 42 times as many people at that cut off.” – Steven Pinker

In short, according to Steven Pinker there are 42 times more chances for a Jewish baby to be born an IQ genius than for an European one… But, is that really so?

jews_vs_europeans.png

Continue reading

15 to 42 percent of medical research are false positives (Yet Another Calculation)

A while ago I found a very interesting paper from Leah R. Jager and Jeffrey T. Leek  via a post in the Simply Statistics blog arguing that most published medical research is true with a rate of false positives among reported results of 14% ± 1%.  Their paper came as a response to an essay from John P. A. Ioannidis and several others authors claiming that most published research findings are false.

After dealing with some criticisms Mr. Leek made a good point in his post:

“I also hope that by introducing a new estimator of the science-wise fdr we inspire more methodological development and that philosophical criticisms won’t prevent people from looking at the data in new ways.”

And thus, following this advice, I didn’t let criticisms prevent me from looking at the data in a new way. So for this problem I have devised a probability distribution for p-values to then fit the data via MLE and infer from there the rate of false positives.

pvalues PDF CDFSo this is my take; 15.33% rate of false positive with a worse case scenario of 41.75% depending on how mischievous researchers are but, in any case, and contrary to what others authors claim, most medical research seems to be true.

Continue reading

Climategate (3/3): Fear mongering

The last post in this Climategate series is dedicated to the climate of fear mongering we all see every now and then in the media claiming extreme weather patterns linked to global warming in an end-of-the-world tone. I will offer some insights and calculations to show that “extremist” might be wrong.

So let us begin with the Australia Climate Change? New Colors Added To Forecast Maps news that spread like… well.. wildfire not just in Australia but through all over the world.

o-AUSTRALIA-CLIMATE-CHANGE-570

It seems that poor climatologists in Australia had no choice but to reuse the purple color already in use for the negative range (-25, -18) ºC for the positive range (50, 54) ºC. What could possibly have done these people but to mix cold and hot weather colors!? well, here’s an idea:

Not Scary Colors for Australian Temperatures

There it goes a present for climatologists in Australia; 121 not scary-oh-my-gaw-how-hot-it-is different colors for the range (-60,60) ºC, and just in case you need more I have a few spare millions. You’re welcome.

Okay, okay, to be fair Continue reading

Climategate (2/3): be careful what you model for because you might get it

In the previous post I showed how James Hansen at GISS NASA clearly over estimated global warming in the late 80’s due to the modeling choices he made. To make a point on how influential the choice of a model is, in this post I will make modeling choices that will allow us to claim that global warming can be explained as a fluke in a random process.

I like to explain the relationship between data and models saying that data is the shadow reality casts, and models are what we believe is casting the shadow. So once we have a model  we can use it to cast shadows (make predictions) like the one James Hansen did and could be read in 1986 newspapers:

Hansen predicted global temperatures should be nearly 2 degrees higher in 20 year. “Which is about the warmest the earth has been in the last 100,000 years.”

Interestingly James Hansen downgraded his prediction in a 1988 paper from the nearly two degrees higher to a one degree higher. Though to be fair I would not be surprised if media misquoted him; I might not trust scientists but I absolutely distrust media.

Anyhow, let’s now compare NASA’s prediction in this 1988 paper (in red) to what actually happened years later (in blue):

Yearly Average Global Temperature Change
1988 NASA predictions on top of yearly average global temperature changes with major volcano activity and parts per million levels of CO2

Data for this plot comes from the B.E.S.T and N.O.A.A.

Continue reading

Climategate (1/3): be careful what you model for because you might get it

Deception is all around us, in every little parcel of our life; from our personal Bart Simpson’s “It wasn’t me” to our local TV news host selling us the latest “You’re not going to believe this” but we eventually do. One might just wish there would exist communities out there with higher standards like, for example, Christians priests but, nope, they cover up pedophile networks in order to preserve The Church’s “good” name. But how about the atheist priests a.k.a scientists? How about their standards?

Well, unfortunately the community of scientists might have more to do with priesthood than one might expect or desire, and a nice example of this would be the Climategate (or the Climatic Research Unit email controversy, as some people had the kindness to rename the Climategate article in the Wikipedia following Fox News’ motto “fair and balanced” )

So in this post I am going to replicate earlier studies on global warming to uncover how over pessimistic were the maths models of the past, but I will also talk about human weakness, and scientists are human… for now.

Mike's Trick
Click to watch Dr. Richard A. Muller (Professor of Physics at the University of California at Berkeley) talk about “Mike’s Trick” and the Climategate.

Continue reading

Astrology: The woo-woo that works

French psychologist Michel Gauquelin gained notoriety in the 50’s after publishing data showing that sportsmen were born in a non random fashion when considering the movement of planet Mars, the nicknamed Mars Effect has been the core of passionate discussions over its statistical validity since then but, beyond whether this effect truly holds or not, there are many reasons why genuine statistically significant data can be found in the astrology world, so we’d do better not to ignore planets and stars entirely.

mars_effect
Number of sportsmen born given the position of planet Mars according to Gauquelin’s data

We humans develop efficient strategies in our daily life that are useful for most situations, for example, if we see dark clouds and a few moments later it rains we associate dark clouds with rain and, voilà, next time we see dark clouds we take measures. The problem begins when we break a leg right after seeing a black cat, our association machine, a.k.a brain, does its magic and next time we see a black cat we take measures too. But you know what? The brain is right!

What is not so right is human difficulties to removed associations once they are set in our brains, a.k.a stubbornness. We humans develop all sort of strategies too keep our associations alive and demand extraordinary amounts of evidences to break them yet, even when those evidences are presented, we keep fighting them by doubting the methodology or the honesty of the persons bringing them up. There might be evolutionary advantages explaining why we create associations so easily but cannot break them with the same ease, but whatever the reasons are the problem only worsens when in some cases our stubbornness makes the associations come true! And that is what astrology is all about. These are a few examples of how astrology makes spurious associations come true: Continue reading

Israel vs Palestine: Who is to blame according to statistics?

Data seems to suggest that, though Palestinians are the ones more actively looking for troubles they are also the ones more actively looking for solutions, whereas Israelis seem to adopt a more nonchalant attitude either way.

Child killed by IDF strikesAhmed Jabari Martyr

Ahmed Jabari TerroristIDF targets

When Hell opens its gates in the Holly Land this is how the story goes most of the time: Continue reading